


LUC & Soil Mapping
Farm-scale Land Use Capability (LUC), Land Resource Inventory (LRI) and soil mapping — at the right intensity for your farm or orchard plan.
Farm-Scale LUC & Soil Mapping
We map land for what it can actually do. Using the New Zealand LUC framework — the eight capability classes, the erosion, wetness, soil and climate limitations, and the LRI factors underneath — we map your farm at the intensity your land use needs, from extensive hill country to intensive horticulture.
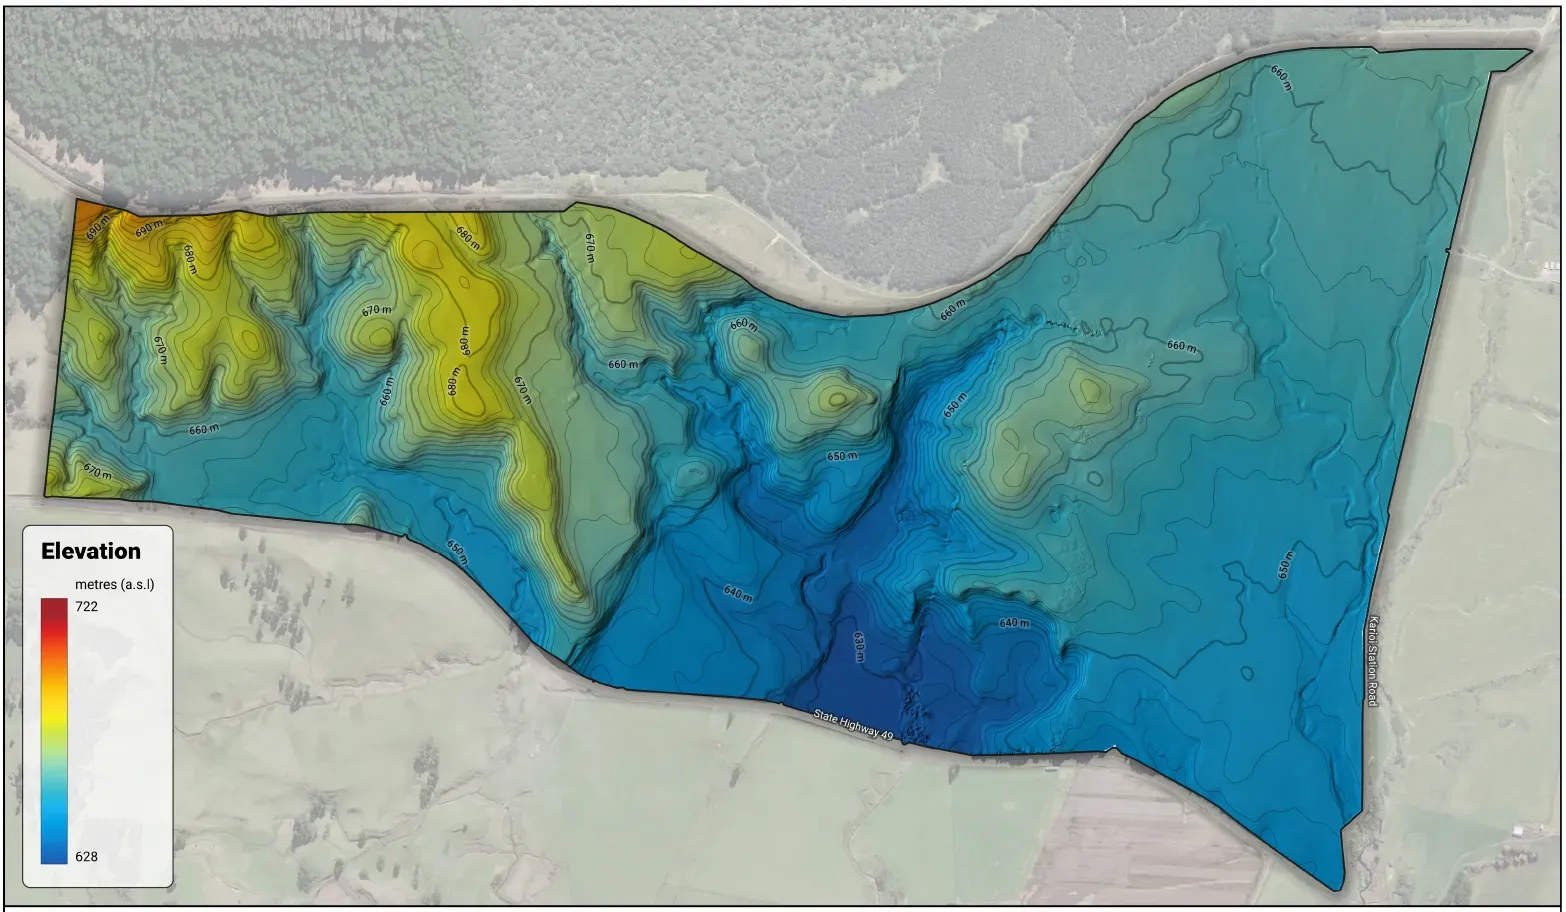
The national LUC and soil layers were surveyed at 1:50,000 — they’re not fit for farm planning, and we won’t pretend otherwise by stretching coarse data to farm scale. We get on the ground, use the LiDAR where it counts (slope is genuinely farm-scale), and give you maps you can actually plan and comply off.
- Farm-scale mapping at the right intensity
- LUC, soil, geology, slope, erosion and vegetation
- Maps that earn their keep beyond compliance
Common Challenges
Farmers face real pressure meeting council and assurance requirements while keeping the farm running. We help you navigate freshwater, NZFAP+ and land-management challenges with practical mapping and planning.
National Maps Are Too Coarse
The national LUC and soil layers were surveyed at 1:50,000 — fine for a region, useless for a paddock. Farm planning needs mapping at farm scale, not coarse data stretched to fit.
Land That Changes Paddock to Paddock
Soil, slope, geology and erosion can shift across a single gully. Classifying that accurately takes someone who knows the LUC framework and gets out on the ground to check it.
It's a Core Plan Requirement
LUC and soil mapping underpins freshwater farm plans, NZFAP+ and resource consents. Get the land resource right and the rest of the plan stands on solid ground.
What You Get
Our Capabilities
Everything you need for farm-scale mapping, certified farm plans, and regulatory compliance across New Zealand.
LUC Mapping
LAND USE CAPABILITY
We classify your land by its capability — the eight LUC classes and the e/w/s/c limitations — at the scale your plan needs, so each block is mapped for what it can actually sustain.
- LUC class and subclass to the national standard
- Capability units matched to the regional legend
- Sheep & beef, dairy, arable and horticulture
Soil Mapping
FARM-SCALE SOILS
Farm-scale soil mapping that picks up the variability the national surveys miss — soil types, depth, drainage and the limitations that drive how each block performs.
- Soil series identified and mapped on the ground
- Depth, drainage and stoniness assessed
- Limitations that matter for management
Land Resource Inventory
THE FIVE LRI FACTORS
A full LRI behind the LUC — rock type, soil, slope, erosion and vegetation mapped across the farm, so every capability call is backed by the factors underneath it.
- Rock type and geology
- Slope mapped from LiDAR — genuinely farm-scale
- Present and potential erosion assessed
Our Proven Approach
A structured, field-verified process that delivers accurate farm-scale maps and audit-ready plans with minimal disruption to your farming operation.
Desk Study
We review the existing soil, geology and terrain data and the LiDAR to plan an efficient field survey, focused where the land actually varies.
Field Survey
We get on farm and traverse the property — checking soils, slope, geology and erosion against the ground, at the intensity your plan calls for.
Mapping
We draw accurate, georeferenced LUC and soil maps in GIS, classified to the national standard and matched to the right scale for your land use.
Report & Delivery
You get the maps and LRI report ready to drop into a farm plan, a council submission, or day-to-day farm management.
Packages ThatInclude This Service
Get Farm-Scale Maps That Are Fit for Purpose
High-quality LUC and soil maps at the right scale for your farm type. Talk to us about your mapping needs.
Mapping Standards & Scale
We map to the New Zealand LUC standard at the intensity your land use calls for — so your maps are genuinely fit for purpose, not coarse data dressed up as farm-scale.
- Sheep & beef: ~1:10,000–1:15,000
- Dairy: ~1:7,500–1:10,000
- Intensive arable: ~1:5,000–1:7,500
- Horticulture: <1:5,000