


Almost every decision on a farm runs back to the soil — what to grow, where to graze, how much fertiliser, which paddocks to drain. Good soil information is worth real money. The catch is knowing which source to trust for what, and not mistaking a regional map for paddock truth.
Three sources, three jobs
- Your own knowledge. Decades of watching where it stays wet, where it dries out, where the slips start. Priceless — and the thing every map should be checked against.
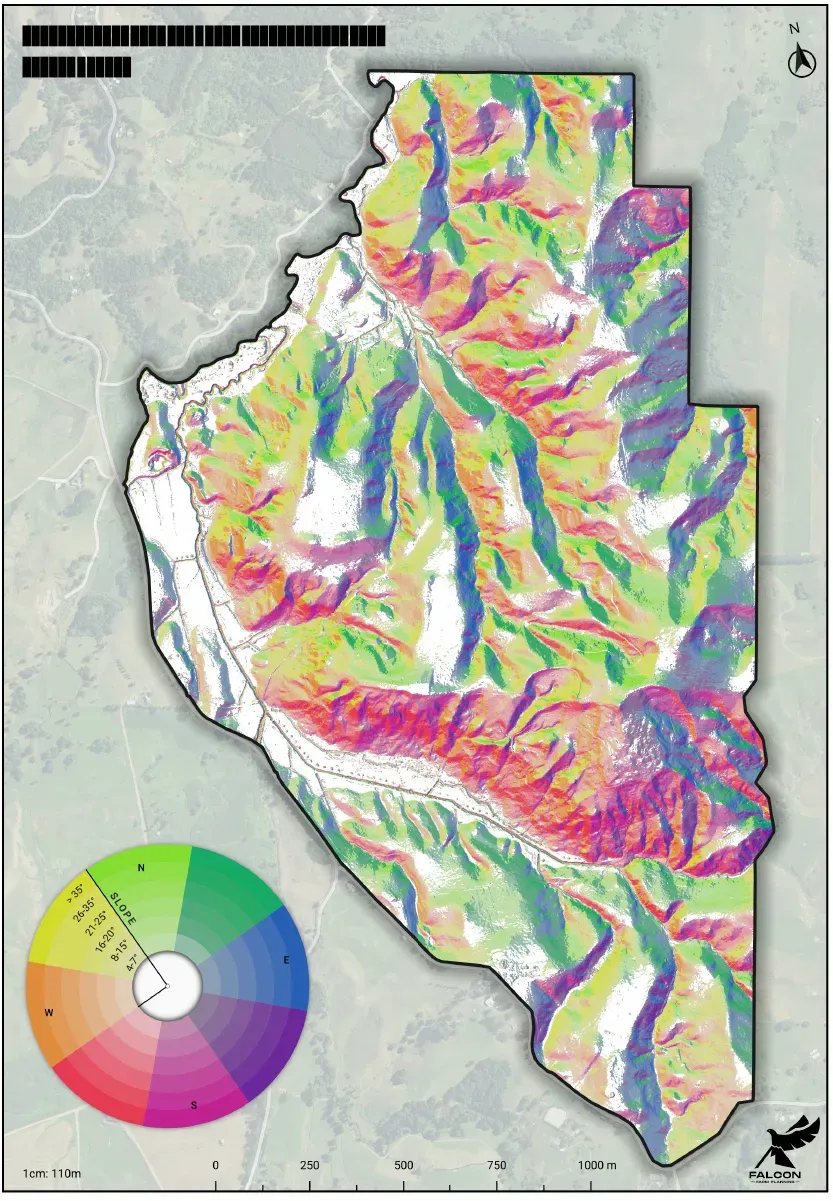
- The national soil map (S-map / NZLRI). Free, instant, covers the whole farm. But it’s mapped at roughly 1:50,000 — a regional draft, not a paddock survey. Treat it as a strong starting hypothesis to verify, not gospel.
- Soil tests. The farm-scale ground truth. Olsen P, pH, sulphur, drainage — measured on your dirt, in your paddocks.
The art is layering them: the national map sketches the pattern, your tests and your eye confirm or correct it.
What good soil info actually buys you
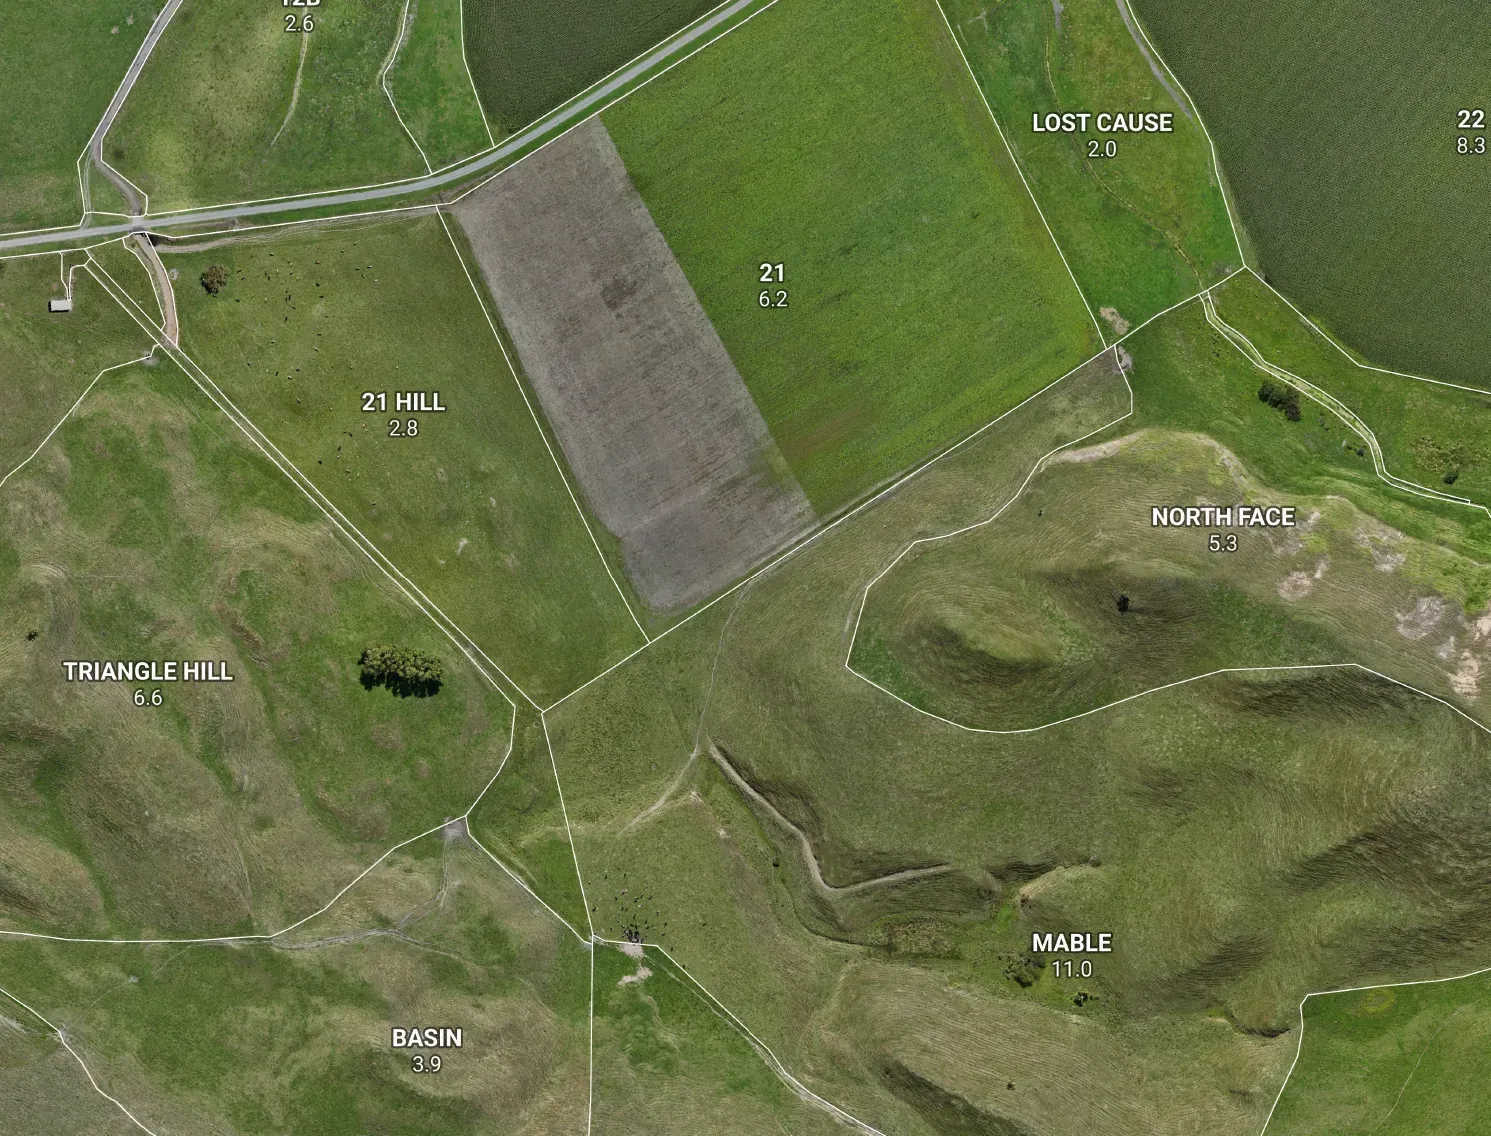
- Fertiliser where it pays. Olsen P and pH by block, not by whole-farm average, so you spend on the paddocks that respond.
- Knowing each block’s ceiling. Set production targets the land can actually hit, instead of chasing a flat paddock’s yield on a dry hill face.
- Spotting the fragile ground. Shallow, erosion-prone or poorly drained soils that need careful management before they cost you.
- Evidence for the plan. Soil data is what turns a farm environment plan — or a buyer’s sustainability question — from a claim into a record.
Be honest about precision
A soil map drawn at 1:50,000 can’t tell you what’s happening in a single wet corner. That’s not a flaw to paper over — it’s the reason you ground-truth. The farms that get the most from soil information treat the map as a draft and their own tests as the verdict.
The bottom line
Good soil info isn’t one magic dataset. It’s the national map, your soil tests and your own eye, each used for what it’s good for. Get that mix right and every downstream decision — fertiliser, grazing, drainage, compliance — gets sharper.